Actively Care About Energy Savings? Try a Passive House
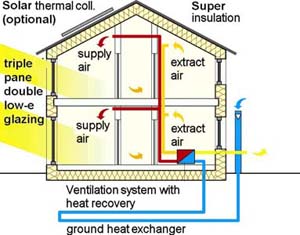
photo credit: wikipedia
The New York Times this weekend had an interesting article on passive houses, a building standard popular in Europe that reduces energy consumption for heating and cooling by 90% compared to a conventional home.
It has been a good deal more expensive to build, however, than the average home. That might partly explain why the passive-building standard is only now getting off the ground in the United States — despite years of data suggesting that America’s drafty building methods account for as much as 40 percent of its primary energy use, 70 percent of its electricity consumption and nearly 40 percent of its carbon-dioxide emissions.
Proponents of the standard, who note that passive homes often use up to 90 percent less heating and cooling energy than similar homes built to local code, say the Landaus embody the willingness of more homeowners to embrace passive building in the United States. Even Habitat for Humanity, the affordable-housing philanthropy, is now experimenting with the standard.
Yet the market remains minuscule, and the materials and expertise needed to build passive homes are often hard to find. While some 25,000 certified passive structures — from schools and commercial buildings to homes and apartment houses — have already been built in Europe, there are just 13 in the United States, with a few dozen more in the pipeline.
To achieve the passive house standard, homes are airtight and fitted with thick insulated walls and floors, triple-paned windows placed with extra care towards how much and what type of sun they receive, and a sophisticated ventilation system to maintain temperatures, all of which is calculated by a computer model.
The whole idea can start to seem a bit fussy though when the orientation for a pleasant view out the window cannot be had because it is not ideal for solar energy, or a fireplace is considered too inefficient, or the triple-paned windows had to be exported into the United States because an energy-efficient equivalent couldn't be found locally.
Like any other new technology that promises an energy-efficient future -- solar panels and electric cars -- the cost of early adoption can be prohibitively expensive now but payoff with time. The Times article estimated that it cost the builders an extra $50,000 to meet passive house standards, which would be earned back in energy savings within 10 years.
But with the median age of homes in the U.S. at 36 years, the basic concepts of a passive house can still be trickled down to currently inefficient homes by renovations such as reducing draft, better insulation, double-paned windows, or planting a tree outside to block summer sunlight.
Recommended Reading:
Where Are We Now? 2000 to 2010 Silicon Valley Real Estate Report
Real estate levels in 2010 appear to be either dropping or freezing nationwide during the usually active spring and summer months due to the wake of the 2007 housing crisis. But in Silicon Valley, where the characteristically warmer temperature seems to not only apply to the weather, the local real estate is making its way back from the extremes of a couple years ago. So from 2000 to the second quarter of 2010, where is the Silicon Valley housing market now? Pretty much where we started. Number of closed sales for single-family homes in Santa Clara County during the second quarter of 2010 are down 4% from the same period in 2000; and the average sales price is up 3%.
This post is an update of an earlier market analysis that we did in 2007. And in the graphs below we’ll be able to see the dot-com bubble burst, the effects of the 9/11 terrorist attacks, the housing bubble develop and pop, and the current signs of a housing recovery. The data is collected from 2000 to the second quarter of 2010 from all 15 cities of Santa Clara County off of MLS listings Inc., looking at single-family homes and condominiums/townhouses._
Number of closed sales in Silicon Valley

The sales spikes we see every year are part of a natural market cycle that peaks in the spring and dips in the winter. Competition is greatest in the spring when the most inventory is available and the most prospective buyers are out looking.
Sales numbers were negatively affected by the dot-com bubble burst in 2001 but shot back up once the housing bubble formed. What’s closest to buyers and sellers minds alike is the housing crisis that bottomed out in 2008. Silicon Valley’s strong economy (that some reports say is losing its edge) has meant a swifter recovery than the rest of the nation.
If the economy continues its recovery, the housing market could return to a seller's market. But sales numbers are only one facet, where other areas of the market are still depressed.
Average days on market in Silicon Valley

Average days on market (DOM) is less influenced quarter by quarter from natural market cycles compared to number of sales. Homes were being sold at record pace in 2000 and between 2004 to 2006. The two recessions in the last 10 years pushed DOM to above two months, even up to three. Though desirable homes in good neighborhoods will always sell quickly, the housing bubble inflated everything, which resulted in a flood of overpriced homes during the crisis and pushed DOM upward.
Since low DOM numbers are attractive to buyers, they are sometimes falsified to make a house appear more attractive on the market. Or poor sales strategies can make an otherwise good home sit on the market for an extended period of time. So don’t let DOM be the final judgement when deciding on a house. But overall a low DOM is a good indicator of market health.
Average sales price in Silicon Valley

Here we can see how big the housing bubble really was. With the dot-com bubble, money was focused in the stock market. But when that crashed, homes became “hot,” lending requirements loosened, and real estate became the new investment trend.
The recession in 2001 dropped the average price for single-family homes 19% from its peak ($750,039) in the second quarter of 2000 to the low ($605,286) in the fourth quarter of 2001; compared to the 48% drop from the housing market bubble peak ($1,083,930) in the second quarter of 2007 to the low ($568,542) in the first quarter of 2009.
Currently, home prices in Santa Clara County are on the rebound and trending towards 2000 and 2004 numbers. Strong markets in smaller cities like Palo Alto and Los Altos faired much differently than the large city of San Jose because of a difference in demand and foreclosure rates.
Sale-to-list price ratio in Silicon Valley

The ratio compares buyer and seller perceptions, where above 100% is a seller's market and below 100% is the opposite. The bubbles and crashes are clearly seen here but reflected in a much different way than what is seen in the average sales price graph. The boom in the early 2000s shows that buyers where much more willing to pay over listing price until the 2001 recession. The ratio later peaked again in 2005. Sellers priced their homes much higher during the real estate bubble but the ratio stayed near 100%, meaning buyers believed the inflated prices were worth the investment.
In recession periods buyers are hesitant and sellers have to adjust their listing price. Today, the average listing price is increasing again with the ratio near 100%.
Takeaway:
The graphs above give a bird’s-eye view of the real estate market in Santa Clara County beginning to settle. Although it may be a very different perspective from an individual home buyer or seller, who could have gotten caught in either the bubble or the crash. The view can also be very different city to city, reflecting hyper-local markets, as we have seen in our second quarter 2010 analyses of Los Altos, Mountain View, Palo Alto, and Sunnyvale. The main idea of these graphs is to show that real estate markets, while unpredictable, are cyclical.
Top 10 Ways an Agent Can Sell Your Home for the Highest Price

So you are ready to move out and sell your home. And you found yourself a real estate agent to help save time, expenses, and the headache of navigating the myriad of details that go into putting a house on the market. But not all agents have the professional experience necessary to sell your home quickly and for the highest price. Or even worse, they are lazy. Here are 10 best practices that a good listing agent will use to get the best price for your home:
1. Conduct a pre-sale inspection with the seller
A good listing agent should meet with the seller and do a walk-through of the property. With a fine-toothed comb, both of you should look for problem areas that can be easily fixed before getting professional inspections and listing your home.
Few agents are willing to do the extra work of a pre-sale inspection, but fixing a leaky faucet or other easy to address problems beforehand will mean a cleaner report when the professional inspector comes through, and potential buyers see less initial issues with your home.
2. Getting and reviewing necessary professional home inspections

Depending on the age, size, location, and condition of a home, an agent will be able to advise what are the required and recommend home inspections. Some common inspections are termite, general property, roof, and chimney. They are not always required on the seller side but it leaves a better impression if you do. (Buyers note: get your own inspection to verify a seller’s report.)
Also, without all the necessary inspections, a home cannot be accurately valued. In this situation the buyer makes an offer and then conducts an inspection only to find out something the seller didn’t know. The buyer will then renegotiate a lower price or, at worst, take back the offer.
3. Price it right from the start
We all want our home to sell for what we have personally invested in it, but overpricing will just make it harder to sell. Buyers are weary of a house that is not priced accurately, which results in less offers, a prolonged marketing period, makes the competition look better, and may eventually sell for below market value.
A listing agent should know the value of a home based on the local market and price it accordingly, maybe even modestly, to create demand and let buyers push up the price through multiple offers.
4. High-quality marketing material
Make your home look its best. If your home needs it, your agent should put you in contact with a home staging professional to target your buyer market. For advertising work, an experienced home photographer and graphic designer can help present the strengths of your home.
5. Generate buyer interest through the Internet

A 2009 study by the National Association of Realtors found that 90% of buyers use the Internet when searching for a home. There is no reason why your agent shouldn’t be taking advantage of this large and affordable medium.
Internet marketing should include a dedicated home website, with a slide show or video tour of the home, and advertising through various social media and syndicated websites.
With a larger audience, your home has a higher chance of receiving multiple offers and, ultimately, a higher selling price.
6. Prepare a listing disclosure package before going on the market
Without a properly prepared disclosure package how can a potential buyer have all the information they need to know about pricing and specific details of a home. A disclosure package needs to include seller requirements, previous inspections and modifications, HOA documents (if any), and a seller wish list.
7. A seller wish list
This gives basic instructions of how to structure a potential offer, but more importantly, lets the buyer know conditions or expectations that make for a strong offer. For example, the seller may want to sell the house as-is, or rent back the house after it has been sold. A careless agent wouldn’t take the time to make a wish list and instead let a potential buyer set the offer conditions.
8. Setting up a broker tour

One of the advantages of having an agent is holding a broker tour. It’s an opportunity to have local real estate agents view a home and receive valuable feedback on the pricing, condition of the property, and network with agents who have potential buyers. The more qualified buyers looking at a home will drive demand and increase perceived value. If your agent isn’t doing this, they aren’t doing one of their primary jobs: to market the home.
9. Following up after a broker or open house tour
A listing agent should contact any agents with buyers or potential buyers who might be interested in putting down an offer. A less proactive agent would wait for offers to come in.
Just as important as receiving offers, is knowing how many potential buyers there are. It helps in negotiations by leveraging the seller’s position.
10. Track buyer progress during and after escrow period

An offer doesn’t mean your agent’s work is done. There are many factors that can unravel an offer from the buyer side that a seller should be aware of.
A good portion of why home purchases fall apart is because of financing. The buyer may not be qualified to purchase the home even though they are pre-approved. An inferior lender may not have the loan approved quick enough or not understand loan qualification requirements, which might happen when a lender is not local.
In addition, your listing agent should regularly contact the buyer’s agent to make sure they finish home inspections and don’t miss contract deadlines during the escrow period. It is a lot harder to sell a home if it goes pending and then comes back on the market because of a buyer issue that could have been prevented by the listing agent doing the research beforehand.
Recommended Reading:
Did you vote 1SiliconValley for Best San Jose Real Estate Blog? – plus a chance to win an Apple iPad (update: we won!)

August 25, 2010 Update: As the banner says, we won! Though I don't have a speech ready, I'd at least like to thank all our blog readers and fans on Facebook for really turning out and pushing us ahead of the competition. The runner-up, CJ Brasiel, runs a great blog and I'm sure she'll be snapping at our blog heels come next year. Also, the iPad raffle winner will be announced at 9 a.m. Aug. 30, 2010, on the Rainmaker Properties company site. Thanks again to all our supporters, and if you have any comments or real estate questions, let us know.
August 17, 2010: That's right! Our blog has been nominated for the “People’s Choice Best Real Estate Blog Award” in San Jose, by Zillow.com. We’d be delighted if you put in your vote for us – actually, you can vote once every 24 hours. But hurry, you only have until noon PST on Wednesday, August 25 to do so.
Oh yeah, if we win the award everyone who voted will be eligible for our Apple iPad (Wi-Fi, 16GB) raffle. Here is how to enter: (1) follow this Zillow link or click the badge above, and vote for 1SiliconValley; (2) if you are not already a fan of Rainmaker Properties on Facebook, we encourage you to become one by clicking the “like” button (not a requirement for contest entry); (3) for every time that you vote, write a comment on our Facebook wall, which will count as your raffle entry – limit one raffle entry per day; (4) lastly, if our blog wins the Zillow award, each one of your entries will be entered into the iPad raffle and the winner will be announced within two weeks of the award date.
So drop your vote, and thanks to all our readers!
A couple items of note: Contest and raffle subject to Rainmaker Properties Best Blog Contest Official Rules. (Opens pdf in new window or right-click to save.) Voting on Zillow requires flash. Sorry iPhone and iPad users.
Silicon Valley Housing Market Trends - Second Quarter 2010 Update
In the second quarter of this year (April to June) we can really see which areas of the housing market have bounced back from the crisis and which areas are still struggling. To visualize those details, and to complement our second quarter 2010 analyses of Los Altos, Mountain View, Palo Alto, and Sunnyvale, we have created some city comparison graphs. We’ll cover total sales volume, sale price to listing price ratio, days on market, median selling price, and number of homes sold, using data on single-family homes off of MLS listings Inc.

First, let’s have a look at:
Total sales volume clearly shows that over the past two-plus years the housing market dropped after peaking in 2008, then slowly bounded up and down, successively higher each quarter. The second quarter of this year really reflects a trend towards returned growth in the housing market of our local cities.
One additional interest to point out is that although most of the cities have not yet reached 2008 sales volumes, Mountain View has surpassed it.

The sales price to list price ratio is one way to show buyer and seller perceptions: above 100% is a seller’s market, and buyers are paying above the listing price to win a house; below 100% is a buyer’s market, and sellers are having to reduce their listing price in order to sell a house. The closer a city is to 100% the more the market is balanced.
On a house that is listed for $1 million, a 1% change would amount to $10,000.
In both quarters this year, Mountain View and Sunnyvale have both been above 100%, a result of high demand for entry-level homes. Palo Alto and Los Altos, the more desirable and expensive of the cities, are still under 100% (Los Altos is at 98.21%, recovering from a glaring low of 93.56% in the beginning of 2009).

_
The Average days on market is a good indicator of buyer demand and the overall health of the housing market. From the graph, we can see all four cities returning nearly to 2008 levels this quarter, with Palo Alto and Los Altos realizing the greatest second quarter drops. This is another signal that the market is shifting to a seller’s market, making it more difficult, once again, for buyers to get find a good deal.

The median selling price can be used in conjunction to the earlier ratio graph. Palo Alto, Mountain View, and Sunnyvale, which are all near or above a 100% ratio, have median prices that are rising. Los Altos, however, is still far from a 100% ratio and its median sales price remains stagnate.
Currently all four cities are off second quarter results in 2008 by more than 5% -- Los Altos is even more at nearly 13% under -- so buyers can still expect to save money due to depreciated home values.

The number of homes sold for each city has either nearly returned to 2008 levels, or surpassed it in the case of Mountain View, which is 50% higher this quarter than the same period in 2008. Part of the reasoning is traditionally more homes go on sale and are bought during the summer months. But this also a result of more sellers willing to sell their homes in a stronger market and a release of pent-up buyer demand.
Recommend Reading:
Palo Alto Housing Market – Second Quarter 2010 Update
Because Palo Alto has a wide range of home prices, the entry-level market remained strong as buyers looked for bargains and the high-end market slowly recovered through the second quarter of 2010.
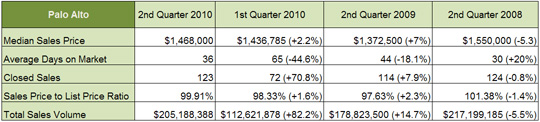
The median sales price in Palo Alto is 5.3% lower than the same period in 2008, at $1,468,000. A huge jump of 82.2% from last quarter and just 5.5% lower than in 2008 was realized in total sales volume, at $205,188,388. Average days on market is just over a month and there were 123 sales this past quarter, similar to 2008.
Palo Alto holds its title as a premier housing market with the highest total sales volume of our four comparison cities, and will continue to become increasingly difficult for buyers to enter the market as the sales price to list price ratio continues its rise to 100%.
Mountain View Housing Market – Second Quarter 2010 Update

Mountain View serves as a good example in our four comparison cities to see that the strongest competition after the housing crisis is for entry- and mid-range homes.
The standout numbers this quarter for Mountain View are 102 closed sales, 121.7% more than last quarter and 50% more than 2008; and $98.5 million in total sales volume, 136.3% more than last quarter and 35.3% more than 2008.
Median sales prices and average days on market are creeping towards 2008 levels. The sales price to list price ratio is just above 100%, meaning seller and buyer perceptions are balanced, though slightly in favor of the seller.
Los Altos Housing Market – Second Quarter 2010 Update

Los Altos burned through the summer months of the second quarter this year as it showed strong signs towards a sustained housing market recovery.
The median sales price slipped 1.4% from the quarter before, to $1.5 million. But the exciting news for home sellers is the precipitous drop in average days on market to 41, from 73 the quarter before, and 98 closed sales, which is equivalent to the same quarter in 2008. The sales price to list price ratio is 98.21%, meaning that more and more buyers are paying closer to list price, reflecting a shift to balanced buyer and seller perceptions. Total sales volume is $160,352,888, which is 17.3% lower compared to the same period in 2008.
Overall, Los Altos realized the greatest drop in mean sales price of our four comparison cities and has yet to recover the nearly 13% difference in price from the same time period in 2008 -- meaning home values are still depreciated in the area.
Sunnyvale Housing Market – Second Quarter 2010 Update

Sunnyvale is one of two cities in our comparison that has turned into a seller’s market the past two quarters. Perhaps it is the urgency of the buyers to find an entry-level house (Sunnyvale has the lowest median sales price of our four comparison cities) before the effects of the housing crisis completely recede that is driving demand.
The median sales price jumped 12.7% compared to last quarter, to $851,000. Average days on market remained the same as last quarter, while number of homes sold was just higher than the same period in 2008, at 177. Sales price to list price ratio is 100.95%, meaning most sellers are encountering multiple offers over listing price.
Although the median sales price and total sales volume are still lagging compared to 2008 numbers, Sunnyvale is reporting strong numbers in other areas this quarter, showing that the city has pushed out of its slump.
Comparing Real Estate Trends of Local Cities
In order to help visualize the previous posts on the 2010 quarterly updates for Palo Alto, Los Altos, Mountain View and Sunnyvale, the graphs below show each city in comparison of overall home sales, median selling price and average days on market. The graphs cover quarterly results from 2008 to 2010 for single-family homes using data from MLS listings Inc.
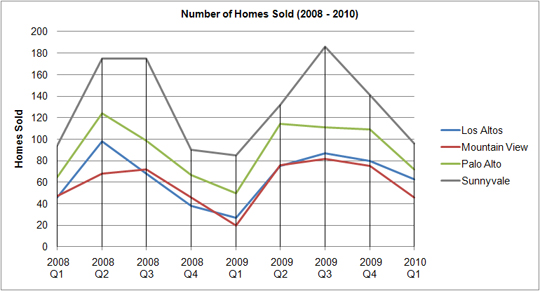
Number of homes sold –
It is hard to see how the cities responded to the crisis within this time frame since most home sales drop off during the winter months and spike in summer. But it is clear that home sales sagged in the first quarter of 2009, were slow to return initially, and then eventually returned to similar or stronger numbers by the end of 2009, which have continued through 2010.

Median selling price –
All four cities home prices started to slip at the end of 2008, with the exception of Mountain View, which dropped a couple quarters later. Prices rebounded mid-2009, after cities like Sunnyvale had bottomed out in the beginning of 2009, and have begun to stabilize at a depreciated value. Los Altos, which has the most expensive houses of the four cities*, realized a 20 percent drop from the beginning of 2008 to 2010; Mountain View dropped 17 percent, Palo Alto dropped 11 percent, and Sunnyvale dropped 15 percent.
*Los Altos may have a higher median selling price than Palo Alto, but part of that is the wider range of home prices available in each of the 14 Palo Alto neighborhoods, where the lower-end is selling quickly, and a population that is double the size of Los Altos. (Expect a post covering Palo Alto neighborhoods in the future.)

Average days on market –
Building up to the crisis, average days on market increased for all four cities until the beginning of 2009. Interestingly, Los Altos and Palo Alto numbers are still increasing today, while Sunnyvale and Mountain numbers are dropping. This may be a result of higher priced homes in Los Altos and Palo Alto that tend to stay on the market longer, especially in a recession, in contrast to the strong demand for the greater supply of low priced entry-level homes in Mountain View and Sunnyvale.
Follow Alex
Topics
- Real Estate (1)
- Real Estate Career (1)
- Saratoga (1)
- design (1)
- office space (1)
- Economic Update (2)
- Journal (2)
- News (2)
- Home Sellers (3)
- santa clara county (3)
- Bay Area Real Estate (4)
- Menlo Park (4)
- Investors (7)
- Los Altos (8)
- New Construction (9)
- Cupertino (11)
- Schools (11)
- Palo Alto (12)
- Communities (15)
- Mountain View (18)
- Bay Area Info (22)
- Home Owners (23)
- Sunnyvale (23)
- Mortgages (26)
- Market Updates (47)
- Home Buyers (64)
- Silicon Valley News (93)