Where Are We Now? 2000 to 2010 Silicon Valley Real Estate Report
Real estate levels in 2010 appear to be either dropping or freezing nationwide during the usually active spring and summer months due to the wake of the 2007 housing crisis. But in Silicon Valley, where the characteristically warmer temperature seems to not only apply to the weather, the local real estate is making its way back from the extremes of a couple years ago. So from 2000 to the second quarter of 2010, where is the Silicon Valley housing market now? Pretty much where we started. Number of closed sales for single-family homes in Santa Clara County during the second quarter of 2010 are down 4% from the same period in 2000; and the average sales price is up 3%.
This post is an update of an earlier market analysis that we did in 2007. And in the graphs below we’ll be able to see the dot-com bubble burst, the effects of the 9/11 terrorist attacks, the housing bubble develop and pop, and the current signs of a housing recovery. The data is collected from 2000 to the second quarter of 2010 from all 15 cities of Santa Clara County off of MLS listings Inc., looking at single-family homes and condominiums/townhouses._
Number of closed sales in Silicon Valley

The sales spikes we see every year are part of a natural market cycle that peaks in the spring and dips in the winter. Competition is greatest in the spring when the most inventory is available and the most prospective buyers are out looking.
Sales numbers were negatively affected by the dot-com bubble burst in 2001 but shot back up once the housing bubble formed. What’s closest to buyers and sellers minds alike is the housing crisis that bottomed out in 2008. Silicon Valley’s strong economy (that some reports say is losing its edge) has meant a swifter recovery than the rest of the nation.
If the economy continues its recovery, the housing market could return to a seller's market. But sales numbers are only one facet, where other areas of the market are still depressed.
Average days on market in Silicon Valley

Average days on market (DOM) is less influenced quarter by quarter from natural market cycles compared to number of sales. Homes were being sold at record pace in 2000 and between 2004 to 2006. The two recessions in the last 10 years pushed DOM to above two months, even up to three. Though desirable homes in good neighborhoods will always sell quickly, the housing bubble inflated everything, which resulted in a flood of overpriced homes during the crisis and pushed DOM upward.
Since low DOM numbers are attractive to buyers, they are sometimes falsified to make a house appear more attractive on the market. Or poor sales strategies can make an otherwise good home sit on the market for an extended period of time. So don’t let DOM be the final judgement when deciding on a house. But overall a low DOM is a good indicator of market health.
Average sales price in Silicon Valley

Here we can see how big the housing bubble really was. With the dot-com bubble, money was focused in the stock market. But when that crashed, homes became “hot,” lending requirements loosened, and real estate became the new investment trend.
The recession in 2001 dropped the average price for single-family homes 19% from its peak ($750,039) in the second quarter of 2000 to the low ($605,286) in the fourth quarter of 2001; compared to the 48% drop from the housing market bubble peak ($1,083,930) in the second quarter of 2007 to the low ($568,542) in the first quarter of 2009.
Currently, home prices in Santa Clara County are on the rebound and trending towards 2000 and 2004 numbers. Strong markets in smaller cities like Palo Alto and Los Altos faired much differently than the large city of San Jose because of a difference in demand and foreclosure rates.
Sale-to-list price ratio in Silicon Valley

The ratio compares buyer and seller perceptions, where above 100% is a seller's market and below 100% is the opposite. The bubbles and crashes are clearly seen here but reflected in a much different way than what is seen in the average sales price graph. The boom in the early 2000s shows that buyers where much more willing to pay over listing price until the 2001 recession. The ratio later peaked again in 2005. Sellers priced their homes much higher during the real estate bubble but the ratio stayed near 100%, meaning buyers believed the inflated prices were worth the investment.
In recession periods buyers are hesitant and sellers have to adjust their listing price. Today, the average listing price is increasing again with the ratio near 100%.
Takeaway:
The graphs above give a bird’s-eye view of the real estate market in Santa Clara County beginning to settle. Although it may be a very different perspective from an individual home buyer or seller, who could have gotten caught in either the bubble or the crash. The view can also be very different city to city, reflecting hyper-local markets, as we have seen in our second quarter 2010 analyses of Los Altos, Mountain View, Palo Alto, and Sunnyvale. The main idea of these graphs is to show that real estate markets, while unpredictable, are cyclical.
Silicon Valley Housing Market Trends - Second Quarter 2010 Update
In the second quarter of this year (April to June) we can really see which areas of the housing market have bounced back from the crisis and which areas are still struggling. To visualize those details, and to complement our second quarter 2010 analyses of Los Altos, Mountain View, Palo Alto, and Sunnyvale, we have created some city comparison graphs. We’ll cover total sales volume, sale price to listing price ratio, days on market, median selling price, and number of homes sold, using data on single-family homes off of MLS listings Inc.

First, let’s have a look at:
Total sales volume clearly shows that over the past two-plus years the housing market dropped after peaking in 2008, then slowly bounded up and down, successively higher each quarter. The second quarter of this year really reflects a trend towards returned growth in the housing market of our local cities.
One additional interest to point out is that although most of the cities have not yet reached 2008 sales volumes, Mountain View has surpassed it.

The sales price to list price ratio is one way to show buyer and seller perceptions: above 100% is a seller’s market, and buyers are paying above the listing price to win a house; below 100% is a buyer’s market, and sellers are having to reduce their listing price in order to sell a house. The closer a city is to 100% the more the market is balanced.
On a house that is listed for $1 million, a 1% change would amount to $10,000.
In both quarters this year, Mountain View and Sunnyvale have both been above 100%, a result of high demand for entry-level homes. Palo Alto and Los Altos, the more desirable and expensive of the cities, are still under 100% (Los Altos is at 98.21%, recovering from a glaring low of 93.56% in the beginning of 2009).

_
The Average days on market is a good indicator of buyer demand and the overall health of the housing market. From the graph, we can see all four cities returning nearly to 2008 levels this quarter, with Palo Alto and Los Altos realizing the greatest second quarter drops. This is another signal that the market is shifting to a seller’s market, making it more difficult, once again, for buyers to get find a good deal.

The median selling price can be used in conjunction to the earlier ratio graph. Palo Alto, Mountain View, and Sunnyvale, which are all near or above a 100% ratio, have median prices that are rising. Los Altos, however, is still far from a 100% ratio and its median sales price remains stagnate.
Currently all four cities are off second quarter results in 2008 by more than 5% -- Los Altos is even more at nearly 13% under -- so buyers can still expect to save money due to depreciated home values.

The number of homes sold for each city has either nearly returned to 2008 levels, or surpassed it in the case of Mountain View, which is 50% higher this quarter than the same period in 2008. Part of the reasoning is traditionally more homes go on sale and are bought during the summer months. But this also a result of more sellers willing to sell their homes in a stronger market and a release of pent-up buyer demand.
Recommend Reading:
Palo Alto Housing Market – Second Quarter 2010 Update
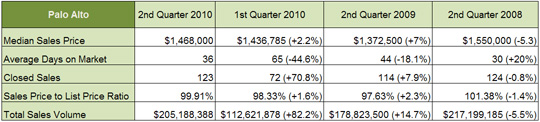
Because Palo Alto has a wide range of home prices, the entry-level market remained strong as buyers looked for bargains and the high-end market slowly recovered through the second quarter of 2010.
The median sales price in Palo Alto is 5.3% lower than the same period in 2008, at $1,468,000. A huge jump of 82.2% from last quarter and just 5.5% lower than in 2008 was realized in total sales volume, at $205,188,388. Average days on market is just over a month and there were 123 sales this past quarter, similar to 2008.
Palo Alto holds its title as a premier housing market with the highest total sales volume of our four comparison cities, and will continue to become increasingly difficult for buyers to enter the market as the sales price to list price ratio continues its rise to 100%.
Mountain View Housing Market – Second Quarter 2010 Update

Mountain View serves as a good example in our four comparison cities to see that the strongest competition after the housing crisis is for entry- and mid-range homes.
The standout numbers this quarter for Mountain View are 102 closed sales, 121.7% more than last quarter and 50% more than 2008; and $98.5 million in total sales volume, 136.3% more than last quarter and 35.3% more than 2008.
Median sales prices and average days on market are creeping towards 2008 levels. The sales price to list price ratio is just above 100%, meaning seller and buyer perceptions are balanced, though slightly in favor of the seller.
Los Altos Housing Market – Second Quarter 2010 Update

Los Altos burned through the summer months of the second quarter this year as it showed strong signs towards a sustained housing market recovery.
The median sales price slipped 1.4% from the quarter before, to $1.5 million. But the exciting news for home sellers is the precipitous drop in average days on market to 41, from 73 the quarter before, and 98 closed sales, which is equivalent to the same quarter in 2008. The sales price to list price ratio is 98.21%, meaning that more and more buyers are paying closer to list price, reflecting a shift to balanced buyer and seller perceptions. Total sales volume is $160,352,888, which is 17.3% lower compared to the same period in 2008.
Overall, Los Altos realized the greatest drop in mean sales price of our four comparison cities and has yet to recover the nearly 13% difference in price from the same time period in 2008 -- meaning home values are still depreciated in the area.
Sunnyvale Housing Market – Second Quarter 2010 Update

Sunnyvale is one of two cities in our comparison that has turned into a seller’s market the past two quarters. Perhaps it is the urgency of the buyers to find an entry-level house (Sunnyvale has the lowest median sales price of our four comparison cities) before the effects of the housing crisis completely recede that is driving demand.
The median sales price jumped 12.7% compared to last quarter, to $851,000. Average days on market remained the same as last quarter, while number of homes sold was just higher than the same period in 2008, at 177. Sales price to list price ratio is 100.95%, meaning most sellers are encountering multiple offers over listing price.
Although the median sales price and total sales volume are still lagging compared to 2008 numbers, Sunnyvale is reporting strong numbers in other areas this quarter, showing that the city has pushed out of its slump.
Palo Alto Housing Market – First Quarter 2010 Update
Current Palo Alto real estate market update for 2010. Looks at median sales price, days on market, and the entry-level and high-end market in Palo Alto.
Palo Alto is one of the premier real estate markets in California, but that doesn’t mean it was able to pass through the mortgage and housing crisis, just two years ago, without a scratch.
Like most of the Bay Area, Palo Alto home prices and inventory dipped following the crisis but are now showing signs of recovering.
Comparing first quarter results between 2008 and 2010, the number of single-family homes on the market went from 81 to 68, and the median sales price from $1.681 million to $1.518 million. First quarter results in 2009 were even lower, with 66 homes sold and a median sales price of $1.275 million.
Again, because of a location in the Silicon Valley, neighboring Stanford University and a top performing school district (news link), Palo Alto homes are some of the last to be hit by a recession and a bellwether out.
When considering a home in Palo Alto, homebuyers have over 14 distinct neighborhoods to consider and home values that range from $800,000 to tens of millions.
Entry-level market
I am seeing a lot of homebuyers trying to take advantage of the dip in local home prices and trying to secure a low mortgage rate right now. As a result, buying an entry-level home in Palo Alto can be a very competitive market.
Most entry-level homes in Palo Alto can be found south of Oregon Expressway, in the Midtown and south Palo Alto neighborhoods.
The median sales price this quarter for the area was $1.27 million; and the average days on market, excluding Midtown and two outlier homes, was 24 days.
Good family homes exist under one million, and I recently sold a three-bedroom, one-bath in south Palo Alto for $950,000 this quarter. But buyers should be aware that strong competition for entry-level Palo Alto homes results in many going above list price after multiple offers are made – sometimes as close to 20 offers.
High-end market
The mortgage crisis has slowed the sales of high-end homes because sellers can afford to wait until home values return. Buyers are also more cautious with their money and may find it difficult to get approved for a jumbo loan under today’s stiff mortgage regulations.
The number of high-end home sales, like in Palo Alto’s Crescent Park neighborhood, are returning back to normal levels this year. In the first quarter of 2008, seven homes sold in Crescent Park at a median price of $4.25 million. In the first quarter of 2009, only two homes sold, the higher one selling for $1.7 million. And in 2010, five homes sold for a median price $2.75 million.
What sold for $1.25 million in 2009 and 2010
A 2,091 square foot, four-bedroom and two-bath, two-story house was originally listed for $1.495 million but sold for $1.25 million in the first quarter of 2009.
The house was built in 1963, sits on a 7,688-square-foot lot and is located at Barclay Court, a cul-de-sac in the Charleston Meadows neighborhood. Inside are oak floors, a combination living and dining room with a fireplace. The house is located next to Robles park and part of the Palo Alto school district.
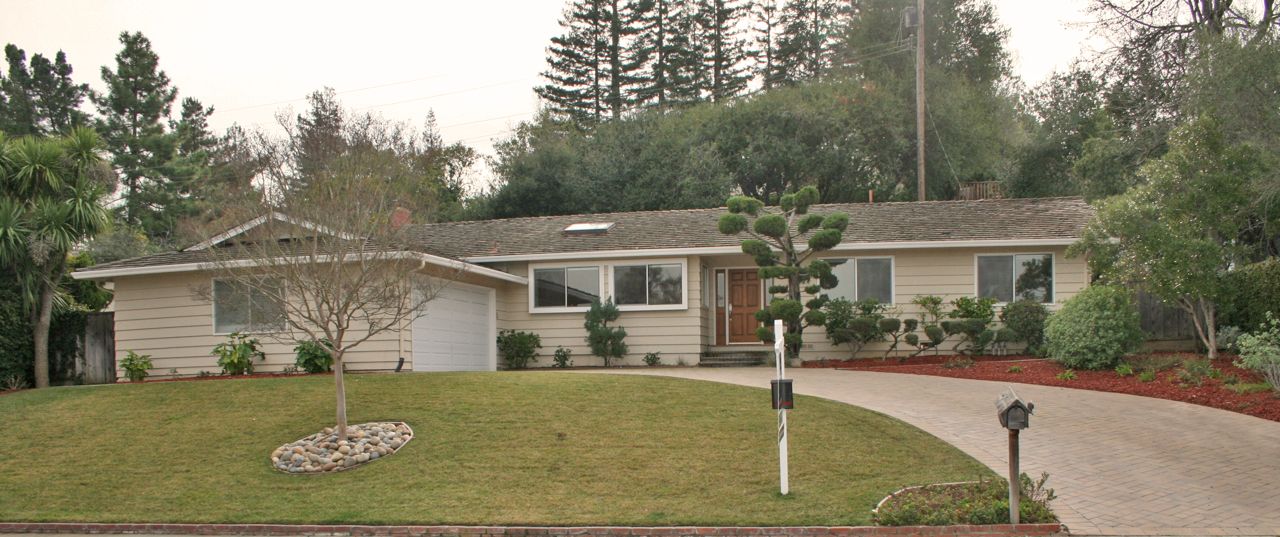
During this past quarter, a 1,324 square foot, three-bedroom and two-bath house was listed for $1.198 million and sold for $1.27 million.
The house was built in 1954, sits on a 9,009-square-foot lot and is located at Fairfield Court, a cul-de-sac in the Green Meadow neighborhood. Inside is hardwood floors, stainless appliances, new fixtures and a combination living and dining room with a fireplace. The large rear yard features a patio.
Market Snapshot - May 3, 2010
There are currently 69 single-family homes and 44 townhomes and condos available. Out of the69 single-family homes, the prices have a wide range from $760,000 to $8,000,000.
Los Altos Housing Market – First Quarter 2010 Update
Current Los Altos real estate market update for 2010. Looks at median sales price, days on market, and factors that help Los Altos homes keep their value.

Home buyers and sellers are quickly returning to Los Altos after a hesitant 2009 period. Los Altos is primarily a single-family home market as we can see in the first quarter of 2010 results, with 63 single-family homes and six condos sold. The average days on market was just about 60 days.
The median price of single-family homes sold in Los Altos this quarter was $1.47 million, which is slightly higher than the previous year’s first quarter results of $1.435 million.
The effects of the mortgage crisis in 2008 and late 2007 is more apparent when we see that only 32 single-family homes were sold in the first-quarter of 2009.
Los Altos has consistently held its home values, and even in a weak national market, home prices are beginning to rise as buyer confidence returns. Home sales were also strong through the traditionally slow winter months, and we are already seeing multiple offers on well priced homes again.
At the same time, the market has cooled compared to the excitement just a few years ago. For example, when I last did a housing market update for Los Altos in September 2007, and the market was around its peak, the median sales price was $1.78 million – 17 percent greater than today. Homebuyers are probably a bit relieved that today’s scale is more balanced between the Los Altos home buyers and sellers.
Recent government tax credits, historically low mortgage rates and the slight dip in local home prices are some of the reasons why homebuyers are trying to take advantage of this time and move into desirable neighborhoods like Los Altos. Besides the city being located in Silicon valley, there is an excellent school district and the homes are known for their larger lot sizes – ideal for families.
School performance, in particular, plays a large role in the stability and value of home prices in an area, and the Los Altos School District has some of the strongest scores on the Academic Performance Index (API) in California. In 2009, Covington Elementary scored 947 out of 1000, and Egan Junior High scored 954.
What sold for $1.47 million –
A 2,279 square foot, three-bedroom, two-and-a-half bath house sold for $1.47 million this past quarter. Built in 1962, the house sits on 10,450-square-foot lot.
The house is located on Kent Drive in the desirable Highlands area close to Cupertino schools. Inside there is a chef’s kitchen with a large granite island, and a formal dining room, family room and living room with a fireplace. Standard amenities and appliances were included.
Market Snapshot – April 28, 2010
There are currently 79 single-family homes and 9 townhomes and condos available. Out of the 79 single-family homes, tw0 dozen are new listings that have recently hit the market, indicating increasing inventory in Los Altos.
One home is short sale. 8 of these homes are new construction with a few 'stubborn' builders reluctant to negotiate early on and with the longest days on market for a listing being 393 days.
The Active continuous days-on-market (CDOM) for single-family homes in Los Altos is 58 days. If you throw out the two properties that have been on the market for more than 300 days, the Active CDOM number drops to 50 days. The average CDOM for properties that sold this year (once again throwing out listings that had a 200+ CDOM) is 35 days, which is a pretty good indicator for when owners should be seriously considering more latitude in their pricing.
Silicon Valley Housing - 2007 Year in Review

I hope you all had a great holiday season and New Years! Looking back, it seems that 2007 was the year of the mortgage for real estate here in Northern California. A screenshot from the New York Times mortgage rate chart illustrates how buyers (and sellers) were impacted by the dynamics of the mortgage industry this year.
This chart shows the change in jumbo mortgage interest rates during 2007. Put in historical context, the jumbo interest rates over the summer didn't approach the level of rates in, say, 1981, but since 2002, the housing market has benefited from mortgage rates that are historically low.
It wasn't 2005 or 2006, though. In May and July, some buyers discovered the home they were interested in just became about 5% more expensive at the same price because of another interest rate bump. (A $1,000,000 P&I mortgage costs $5,996 per month at 6% and $6,321 at 6.5%.) All the more reason to better understand how rate locks work.
Some homeowners with adjustable rates found themselves in a similar situation and ended up attempting a short sale. Many neighborhoods were unaffected, others were peppered with short sales --- where the available homes may or may not have real estate signs indicating a sale.
But many of the markets around Silicon Valley didn't behave like one would expect from reading the news reports. It's the sales transaction information that tells the best story.
Data Points Across the 44 Cities in the Database for Santa Clara County and San Mateo County
1. Of the 35 cities with a decrease in new listings year-over-year, all of the ones in Silicon Valley --- there were 26, East Palo Alto and Milpitas were the exceptions --- saw their median values increase. (The cities outside Silicon Valley seeing decreases included outlying cities Gilroy, Morgan Hill and Loma Mar.)
2. The were 9 cities that had an increase in new listings year-over-year. Not surprisingly, this acceleration of inventory usually means a decrease in the median. It is notable, though, that Santa Clara and Redwood City showed strength and bucked the trend.
3. There wasn't any real correlation between medians and homes "sitting" on the market. San Mateo saw an 18% increase in CDOM (to 39 days) but had an increase of 8% in the median. San Jose's CDOM skyrocketed 29% (to 58 days) but the city as a whole had a median increase of 3.6%. Mountain View and Palo Alto were on fire the entire year and saw their CDOM numbers decrease 29% and 9% respectively.
Silicon Valley's Gains and Losses
Looking at the table, what stood out to me the most was where Menlo Park turned out. I've written previously about how Menlo Park can be a mixed bag and how low-income housing has affected the median --- and while Menlo Park isn't the only city in Silicon Valley to have overnight parking restrictions, I've talked with a number of people who cite it as a reason why they wouldn't buy a home there.
For the city that's part Atherton, part Redwood City, part Palo Alto and part East Palo Alto, Menlo Park was the only one of these five cities to have both an increase in single-family home listings year-over-year and a drop in their median. (Redwood City withstood its 9% increase in listings and still came away with a 4.12% gain.)
There was core strength in the 101 to 85 corridor of Palo Alto, Mountain View, Sunnyvale and Cupertino. High-paying jobs and the perception of a bottomless market ironically helped fuel growth for 2007.
The 30.6% drop in Palo Alto's new listings cut supply rather dramatically. And while Mountain View's drop of 15.5% seems less dramatic in comparison, the average home sold took 22 days to sell. The only number on my spreadsheet to come close to that speed is neighboring Sunnyvale, where the average is 28 days. Sunnyvale, Palo Alto, and Mountain View all recorded sales prices at above 103% of list.
Redwood Shores Housing Market Update - November 2007
There's an opportunity here for my clients looking for a good elementary school district. For single-family homes, the news is almost exactly the same as last year. There were six sales in 2006 and five this year in Redwood Shores. Small statistical sample. The median number has dropped 7.8% year-over-year in October from $1,192,000 to $1,100,000; the average stayed almost the same going from $1,145,500 to $1,145,000, with eight new listings in both periods and an inventory of 14 and 13 in those respective years. The news, though, is in townhomes and condominiums.
In Redwood Shores, there were only three were closed in October 2007 (compared to 15 the year before) with inventory levels similar to 2005 and 2006. The percent of list received went from just above asking to 93.36% this year.
It's sometimes difficult to be the first wave to adjust to a different landscape and changing market conditions, no matter how much data is available. In this case, the initial valuation of these three townhomes was unrealistic, so the percent of list received is lower than it might have been if information about the shifting landscape were already digested.
There are good elementary schools in Redwood Shores. Sandpiper Elementary, part of the Belmont-Redwood Shores Elementary School District, improved upon its elite test scores last year with a 17 point increase to 923. When I last called Sandpiper just after the start of the school year, they were on the border of being over-subscribed, but were still able to take new students.
Obviously, it's important to confirm availability before making a purchasing decision. The Belmont-Redwood Shores district has two other schools over 900 API to choose from if there's a wait list at Sandpiper (Central Elementary and Fox Elementary), and the others two come in at 875 (Cipriani Elementary) and 823 (Nesbit Elementary).
Median Home 2007 - $1,100,000
The Median Home for October 2007 in Redwood Shores is 615 Island Pl., which was actually a bank-owned property. Its hallmark is a palacial master bathroom, which is the size of a bedroom in many older homes. The main living area is also spacious as well, with high ceilings that extend over the second level. The home comes in at 2310 square feet (on a 6053 square foot lot) with 3 bedrooms and 2.5 bathrooms. This single-family home is part of a gated-community with an HOA fee of $230.
Compared With Last Year - $1,192,500
The first Median Home last year was 702 Nature Ln. Located on a corner lot, this 2421 square foot home splits the main living level with the master bedroom and two other bedrooms upstairs but one bedroom and one of the three full bathrooms downstairs. This home was listed as having a "motivated seller", and (originally listed at $1,288,000) it was reduced to $1,265,800 before eventually selling for $1,210,000. The association fee for this home was $135.
1029 Rockport Ave., last year's other Median Home, also has 4 bedrooms --- two of which are master suites --- along with one-and-a-half more bathrooms in the home. It's slightly smaller than Nature, at about 2200 square feet, but also sold for less: $1,175,000. Rockport sold for 1.9% below list, but like Nature, it sits on the water. Some may prefer Rockport's covered arbor, which allows more outside light than a patio that is covered by a second-floor accessible deck.
Market Snapshot - November 9, 2007
As of today, there are 29 townhomes and condos and 12 single-family homes on the market in Redwood Shores. Nine of the townhomes and condos, but none of the single-family homes, have had a published reduction. If you take out the two new homes listed today, the Active CDOM number is 44 days (37 with them included). The Active CDOM number for townhomes is 55 days.
One of these townhomes is an interesting illustration of over-improvement. The home was upgraded from soup-to-nuts: kitchens to bathrooms to floors and paint. And all with top-of-the-line materials. It was pretty clear that no expense was spared and it was decorated to the taste of the current owner. The challenge is that now the property is priced well over the comparables in the area because the seller expects the value of neighboring properties plus the upgrades and a premium for including them.
There is nothing inherently wrong with upgrading to increase the value of a home, but that strategy works particular complexes or neighborhoods can support the number the seller is asking for. (I used the analogy of "lobster on the McDonald's value menu" in my book. Would you pay $13 for anything at McDonald's?)
This complex is a very nice neighborhood but it's difficult to justify a price $200,000 (21%) more expensive than a comparable sale one month ago when many of the upgrades are "six-of-one and half-a-dozen of the other" (i.e. pricey, but low value-add) choices.
The fact is that the list is higher than any number any property has sold for in that complex. The market is sending a clear message. This home has been on the market for almost three months (without a reduction) and it risks joining the five other townhomes that have been on the market for 100 days or longer.
How Much Home Can I Get in Redwood Shores?
This is an overview of representative properties in Redwood Shores which closed in October 2007.
$585,800 - 457 Cork Harbour Cir. #F 2br/2ba; 1136 sqft; HOA $405 2 master suites
$604,500 - 405 Cork Harbour #D 2br/2ba; 1136 sqft; HOA $405 Granite counters; new laminate floors
$620,000 - 1112 Camerota Way 2br/2ba; 1125 sqft; 11 years old; HOA $200 Corner unit
$925,000 - 582 Osprey Dr. 3br/2.5ba; 1550 sqft on 3234 sqft lot Corner lot; separate family room
$1,100,000 - 615 Island Pl. (Median Home) 3br/2.5ba; 2310 sqft on 6053 sqft lot; HOA $230 Gated community
$1,150,000 - 22 Lido Ci. 4br/2.5ba; 2490 sqft on 4000 sqft lot; 29 years old; HOA $72 Newly remodeled kitchen
$1,450,000 - 810 Sun Blossom Ln. 4br/3ba; 2710 sqft on 3998 sqft lot; HOA $108 Newly remodeled kitchen; custom paint
Follow Alex
Topics
- Real Estate (1)
- Real Estate Career (1)
- Saratoga (1)
- design (1)
- office space (1)
- Economic Update (2)
- Journal (2)
- News (2)
- Home Sellers (3)
- santa clara county (3)
- Bay Area Real Estate (4)
- Menlo Park (4)
- Investors (7)
- Los Altos (8)
- New Construction (9)
- Cupertino (11)
- Schools (11)
- Palo Alto (12)
- Communities (15)
- Mountain View (18)
- Bay Area Info (22)
- Home Owners (23)
- Sunnyvale (23)
- Mortgages (26)
- Market Updates (47)
- Home Buyers (64)
- Silicon Valley News (93)