Silicon Valley School System Bang-for-the-Buck
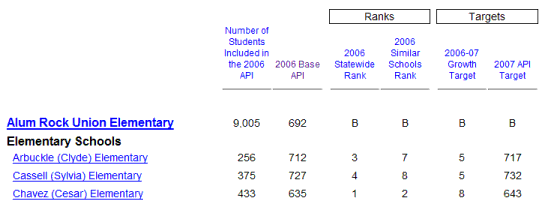
The California Department of Education (CDE) has released the updated 2006 Academic Performance Index (API) scores for California schools, including data for San Mateo County and Santa Clara County. The API is a statewide benchmark based on standardized achievement tests which is primarily used to rank schools relative to one another and relative to schools with similar demographics. Here's an example of what the statistics look like.
We'll take a look at how school rankings and Silicon Valley real estate prices are related, but first let's look at how to read the information.
Number of Students. In the first column, you'll find the number of students whose results were included from that school. It's pretty close to the total number of students, less any excluded students. The rules for excluding students are listed in the API Base Documentation Information Guide found on the CDE API page. Surprisingly, the number of students has little to do with how well the school did in its API scores (almost, see epilogue).
Base API, Statewide Rank, Similar Schools Rank. The Base API score is like an SAT score except it's from 200 to 1000. Higher is better. To make comparing schools easier, the CDE provides a statewide rank from 1 to 10 (ten is best) and a similar schools rank that rates schools (again from 1 to 10, ten being best) that have similar demographics and characteristics. Apples-to-apples in a way.
Growth Target, API Target. The growth target is the number of points California wants the school to improve in the next year. That added with the current base API score equals the API target. The CDE doesn't set a target for schools above the current statewide performance target of 800.
Silicon Valley School District Scores
I've assembled information from the CDE site and the Palo Alto Daily News to provide a table of school district API averages for Silicon Valley and Bay Area elementary and middle schools.
Comparing School Districts and Housing Prices
Remember the chart of median Silicon Valley single-family home prices in February 2007 from my article Determining Your Must-Haves When Buying a House?
Combining the chart for Silicon Valley school district rankings with the one for Silicon Valley median single-family real estate prices brings up some surprises. (I used a simple ratio between how far the API score was above 700 and the median single-family home price. The resulting number isn't really that relevant, it's the visual comparison I was looking for.)
Regarding Schools and Value in Pricing
First, while Cupertino and Foster City housing prices are very similar, there is a vast difference between the performance index of their school districts. On school rankings, compared to Foster City, Cupertino represents a much better value based on the median sale price of single-family homes.
Second, while Los Altos has the highest API scores, it also had a much higher median price putting it on-par with other elite school districts like Palo Alto and Los Gatos, but well-below Saratoga which had both higher test scores and a lower median home price.
Third, it is possible to cherry-pick good schools in average school districts. For example, you can search around Sunnyvale's Cherry Chase Elementary, which has a base API score of 941, if you're looking for a good elementary school. Stay tuned.
[ed. This is the CYA: The data in the report is considered accurate but not guaranteed.]
Epilogue
There's a quirk in the ratings system where only test scores for "statistically significant" groups (read: ethnicities) are counted. Some schools, none that I can find documentation on, were accused of reclassifying lesser performing students into groups that weren't statistically significant to prop up their overall test scores.
There is a measure of transparency, though, because if you drill down on the individual schools, it will show which groups were counted, which weren't, and how many were in each.

