
Los Altos Market Analysis – May 2010 to May 2012
As shown in the charts shown below, Los Altos is a highly desirable city with a strong market and high median price range. While it does border into a balanced market occasionally, Los Alto is to be considered predominantly a seller’s market. Given its average median price range just under $1.6 million, it is surprising that the average DOM is under 30 days and the inventory supply is just about 1 month. With the consistent upward trend in sales absorption and median price since September 2011, we can expect Los Altos to maintain its status as a desirable place to live and will most likely see prices continue their upward trend.
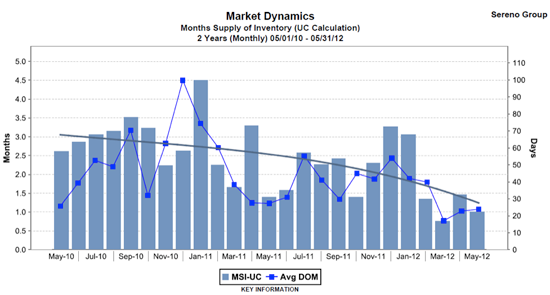
The chart shown above graphs the MSI as well as the DOM for Los Altos. The chart indicates greater fluctuation in DOM statistics when compared with those of the Mountain View market though Los Alto does still follow the seasonal real estate cycles. Currently, the DOM is between 20 and 30 days, and the level of inventory is currently sitting at just over one month.

As with MSI, the sales absorption rate has also been fluctuating a bit more when compared to Mountain View though it has been trending upward overall from May 2010 to May 2012. In May 2012, the current sales absorption rate was 46.3% of properties under contract and 40.7% of properties sold.

The median price in Los Altos is showing a healthy, and likely sustainable, upward trend over the last two years. When discussing Mountain View, Los Altos, Los Altos Hills and Palo Alto, Los Altos is the only market that did not see a dip in late 2010/early 2011. Since September 2011, this upward trend has become a bit more pronounced with the median price in May 2012 being $1,786,500 which is more than $300,000 higher than May 2010.