Palo Alto Housing Market – Fourth Quarter 2010 Update

Palo Alto, the feather in the cap of Silicon Valley real estate, struggled with its median sales price, falling two straight quarters after reaching its peak in second quarter of this year since the housing bust. The fourth quarter of 2010 was lower than the same period in 2008 ($1,350,000) and in 2009 ($1,370,000). This is due to two factors: the real estate market adjusting to pre-bubble prices, and fewer expensive properties being listed because of the deprecated values.
On the positive side, sales are up overall, beating all previous quarters this year and the fourth quarters of 2008 and 2009. The sales price to list price ratio is also one of the most balanced of our four city comparison, and with a ratio just above 100%, the only one favoring the seller.
Los Altos Housing Market – Fourth Quarter 2010 Update

The high home prices of Los Altos influenced how it reacted to the 2007 bust, mainly a hold off of purchasing (only 38 homes sold in the fourth quarter of 2008) and a depreciation of the median sales price.
This past quarter, Los Altos is still struggling in its sales price to list price ratio, a result of many buyers unwilling to pay the full listing price. But this shouldn't overshadow that this quarter the city put up the highest median sales price for the year. And compared to the same period in 2009, the median sales price is up 7% and days on market fell 8%, both good signs.
We can only anticipate what 2011 will be for real estate, but if Los Altos is any indication, higher-priced markets could be shaking off their frost a little sooner than the past few years.
Mountain View Housing Market – Fourth Quarter 2010 Update

Mountain View has been an example of what many buyers and sellers would hope to see in their local market after the housing bust. The city fell, but not as hard as its neighbors, and recovered immediately into a slow rise that continued throughout 2010.
Its weak points this quarter were in average days on market (still better compared to 2009, with 61 days) and a sales price to list price ratio that favors buyers. The median price rose in the fourth quarter, and aligns with the more popular spring and summer months, including besting the same period in 2009 by more than $10,000.
Sunnyvale Housing Market – Fourth Quarter 2010 Update

The winter months are rolling through the fourth quarter of 2010, and home sales have sunk along with the median sales price and average days on market. This is no surprise and remains a truth that there are seasons in real estate, and we can expect it to stiffen as we enter the first quarter of 2011.
Comparing the fourth quarter of 2010 to the same period in 2008 (closed sales, 90; average days on market, 47; median sales price, $656,500) and in 2009 (closed sales, 141; average days on market, 52; median sales price, $760,000), Sunnyvale is wavering but not falling into a double dip market that bearish experts are predicting.
Palo Alto Housing Market – Third Quarter 2010 Update

Palo Alto really established itself this quarter as a market leader. Compared to the third quarter in 2009, Palo Alto has improved in all five measures. This quarter Palo Alto jumped its selling price to listing price ratio ahead of the other three cities in our comparison to 101.26%, turning it into a seller's market. Though, what this means for future home prices or the market is anybody's guess as we enter the winter quarter.

The average days on market in Palo Alto remains the lowest of our four cities at 35 days, a drop from 57 days for the same period last year. Palo Alto also has the highest total sales volume, even though it has the second smallest population in our comparison. This is due to the wide range of property values available in Palo Alto, from just under a million to the many millions.
Los Altos Housing Market – Third Quarter 2010 Update

One thing to consider when looking at data from Los Altos is that its population of around 30,000 is less than half of the next smallest city in our quarterly comparison. But, on the other hand, the median price is the highest at $1,565,000 -- 13% higher than Palo Alto and almost double either Sunnyvale or Mountain View.

In the third quarter of 2010, the median price bumped up 4.3% from last quarter and is equivalent to 2006 levels. Another positive sign for Los Altos is that average days on market is in the 40s range, a significant improvement from the third quarter last year, where it was hanging out at 67 days.
The last item of note for Los Altos is the sales price to listing price ratio has fallen this quarter, 96.96% from 98.21% last quarter. Since 2008, Los Altos has been a buyer's market, while our three other comparison cities have been trending towards a seller's market. Buyers aren't necessarily hesitant but we are seeing a lot of price adjustments in the area.
Mountain View Housing Market – Third Quarter 2010 Update
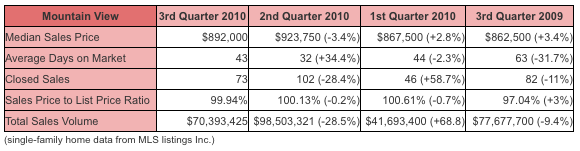
Part of the advantages of Silicon Valley is that the housing market ride for the past few years has been less bumpy than what the nation has experienced. A good example of this calm is in the city Mountain View.
Even examined against our other comparison cities, Mountain View has been the most stable, especially in regard to the median sales price. It bumped up to $1,148,440 during the boon in 2007, but unlike everybody else in 2009, it bumped up instead of sliding. Since then the city median has floated at $900,000 for single-family homes.
Average days on market bumped up and closed sales fell compared to last quarter, but some of that is due to market cycles. The sales price to listing price ratio is at a healthy 99.94%, meaning a fair market for both buyers and sellers.
Part of the stability in Mountain View is due to the reasonable prices compared to Los Altos and Palo Alto. There will always be buyer demand at just under a million, especially since it shares the benefits of being a neighbor to prestigious cities, has good schools, and an ideal location in the Silicon Valley.
Sunnyvale Housing Market – Third Quarter 2010 Update

Sunnyvale has gone through another quarter without any major hiccups, showing improvements from a year ago. The median sales price has been steadily increasing from its recovery in early 2009, and is equivalent to 2006 prices. Average days on market have also dropped to 41 days, down from 77 days in the first quarter of 2009, though it has yet to reach the unusually low 23 days that occurred in the second quarter of 2006.

Lastly, the sales price to listing price ratio is hovering around 100%, meaning sellers are pricing homes at prices buyers expect to pay -- neither a strong seller's market as in 2007, nor a buyer's market as in 2009.
Palo Alto Housing Market – Second Quarter 2010 Update
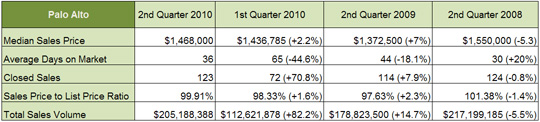
Because Palo Alto has a wide range of home prices, the entry-level market remained strong as buyers looked for bargains and the high-end market slowly recovered through the second quarter of 2010.
The median sales price in Palo Alto is 5.3% lower than the same period in 2008, at $1,468,000. A huge jump of 82.2% from last quarter and just 5.5% lower than in 2008 was realized in total sales volume, at $205,188,388. Average days on market is just over a month and there were 123 sales this past quarter, similar to 2008.
Palo Alto holds its title as a premier housing market with the highest total sales volume of our four comparison cities, and will continue to become increasingly difficult for buyers to enter the market as the sales price to list price ratio continues its rise to 100%.
Mountain View Housing Market – Second Quarter 2010 Update

Mountain View serves as a good example in our four comparison cities to see that the strongest competition after the housing crisis is for entry- and mid-range homes.
The standout numbers this quarter for Mountain View are 102 closed sales, 121.7% more than last quarter and 50% more than 2008; and $98.5 million in total sales volume, 136.3% more than last quarter and 35.3% more than 2008.
Median sales prices and average days on market are creeping towards 2008 levels. The sales price to list price ratio is just above 100%, meaning seller and buyer perceptions are balanced, though slightly in favor of the seller.
Follow Alex
Topics
- Real Estate (1)
- Real Estate Career (1)
- Saratoga (1)
- design (1)
- office space (1)
- Economic Update (2)
- Journal (2)
- News (2)
- Home Sellers (3)
- santa clara county (3)
- Bay Area Real Estate (4)
- Menlo Park (4)
- Investors (7)
- Los Altos (8)
- New Construction (9)
- Cupertino (11)
- Schools (11)
- Palo Alto (12)
- Communities (15)
- Mountain View (18)
- Bay Area Info (22)
- Home Owners (23)
- Sunnyvale (23)
- Mortgages (26)
- Market Updates (47)
- Home Buyers (64)
- Silicon Valley News (93)